

Insights that drive decisions
From a glanceable dashboard to the report that answers the awkward question in a board meeting.
Live dashboards
A configurable widget grid of KPI tiles — bookings, revenue, margin, pipeline — so the team sees performance the moment they log in.
Financial analytics
Revenue, margin, costs and receivables broken down the way a travel business actually thinks about them.
Geographic breakdowns
See where demand comes from and where trips go, on heatmaps and by-market breakdowns.
Commissions & discounts
Track agent commissions and payouts, and see exactly how much margin discounting is costing you.
Drill-down to the detail
Click any number to open the bookings, invoices or products behind it — no exporting to find out why.
Reporting across brands
Consolidate results across linked workspaces for a single enterprise view, or compare brand against brand.
Why teams trust the numbers here
One source, not five exports
Because sales, bookings, invoicing and operations are one system, the reports reflect reality — not a spreadsheet stitched together at month-end.
Margin you can defend
Costing is live and per-line, so revenue and margin reports are grounded in the real numbers behind every trip.
Answers, not just charts
Every metric drills down to the underlying records, so 'why is this down?' takes a click, not a data request.
Built-in compliance views
Ready-made compliance and audit reporting means the answers are there when finance or a regulator asks.
See it in action
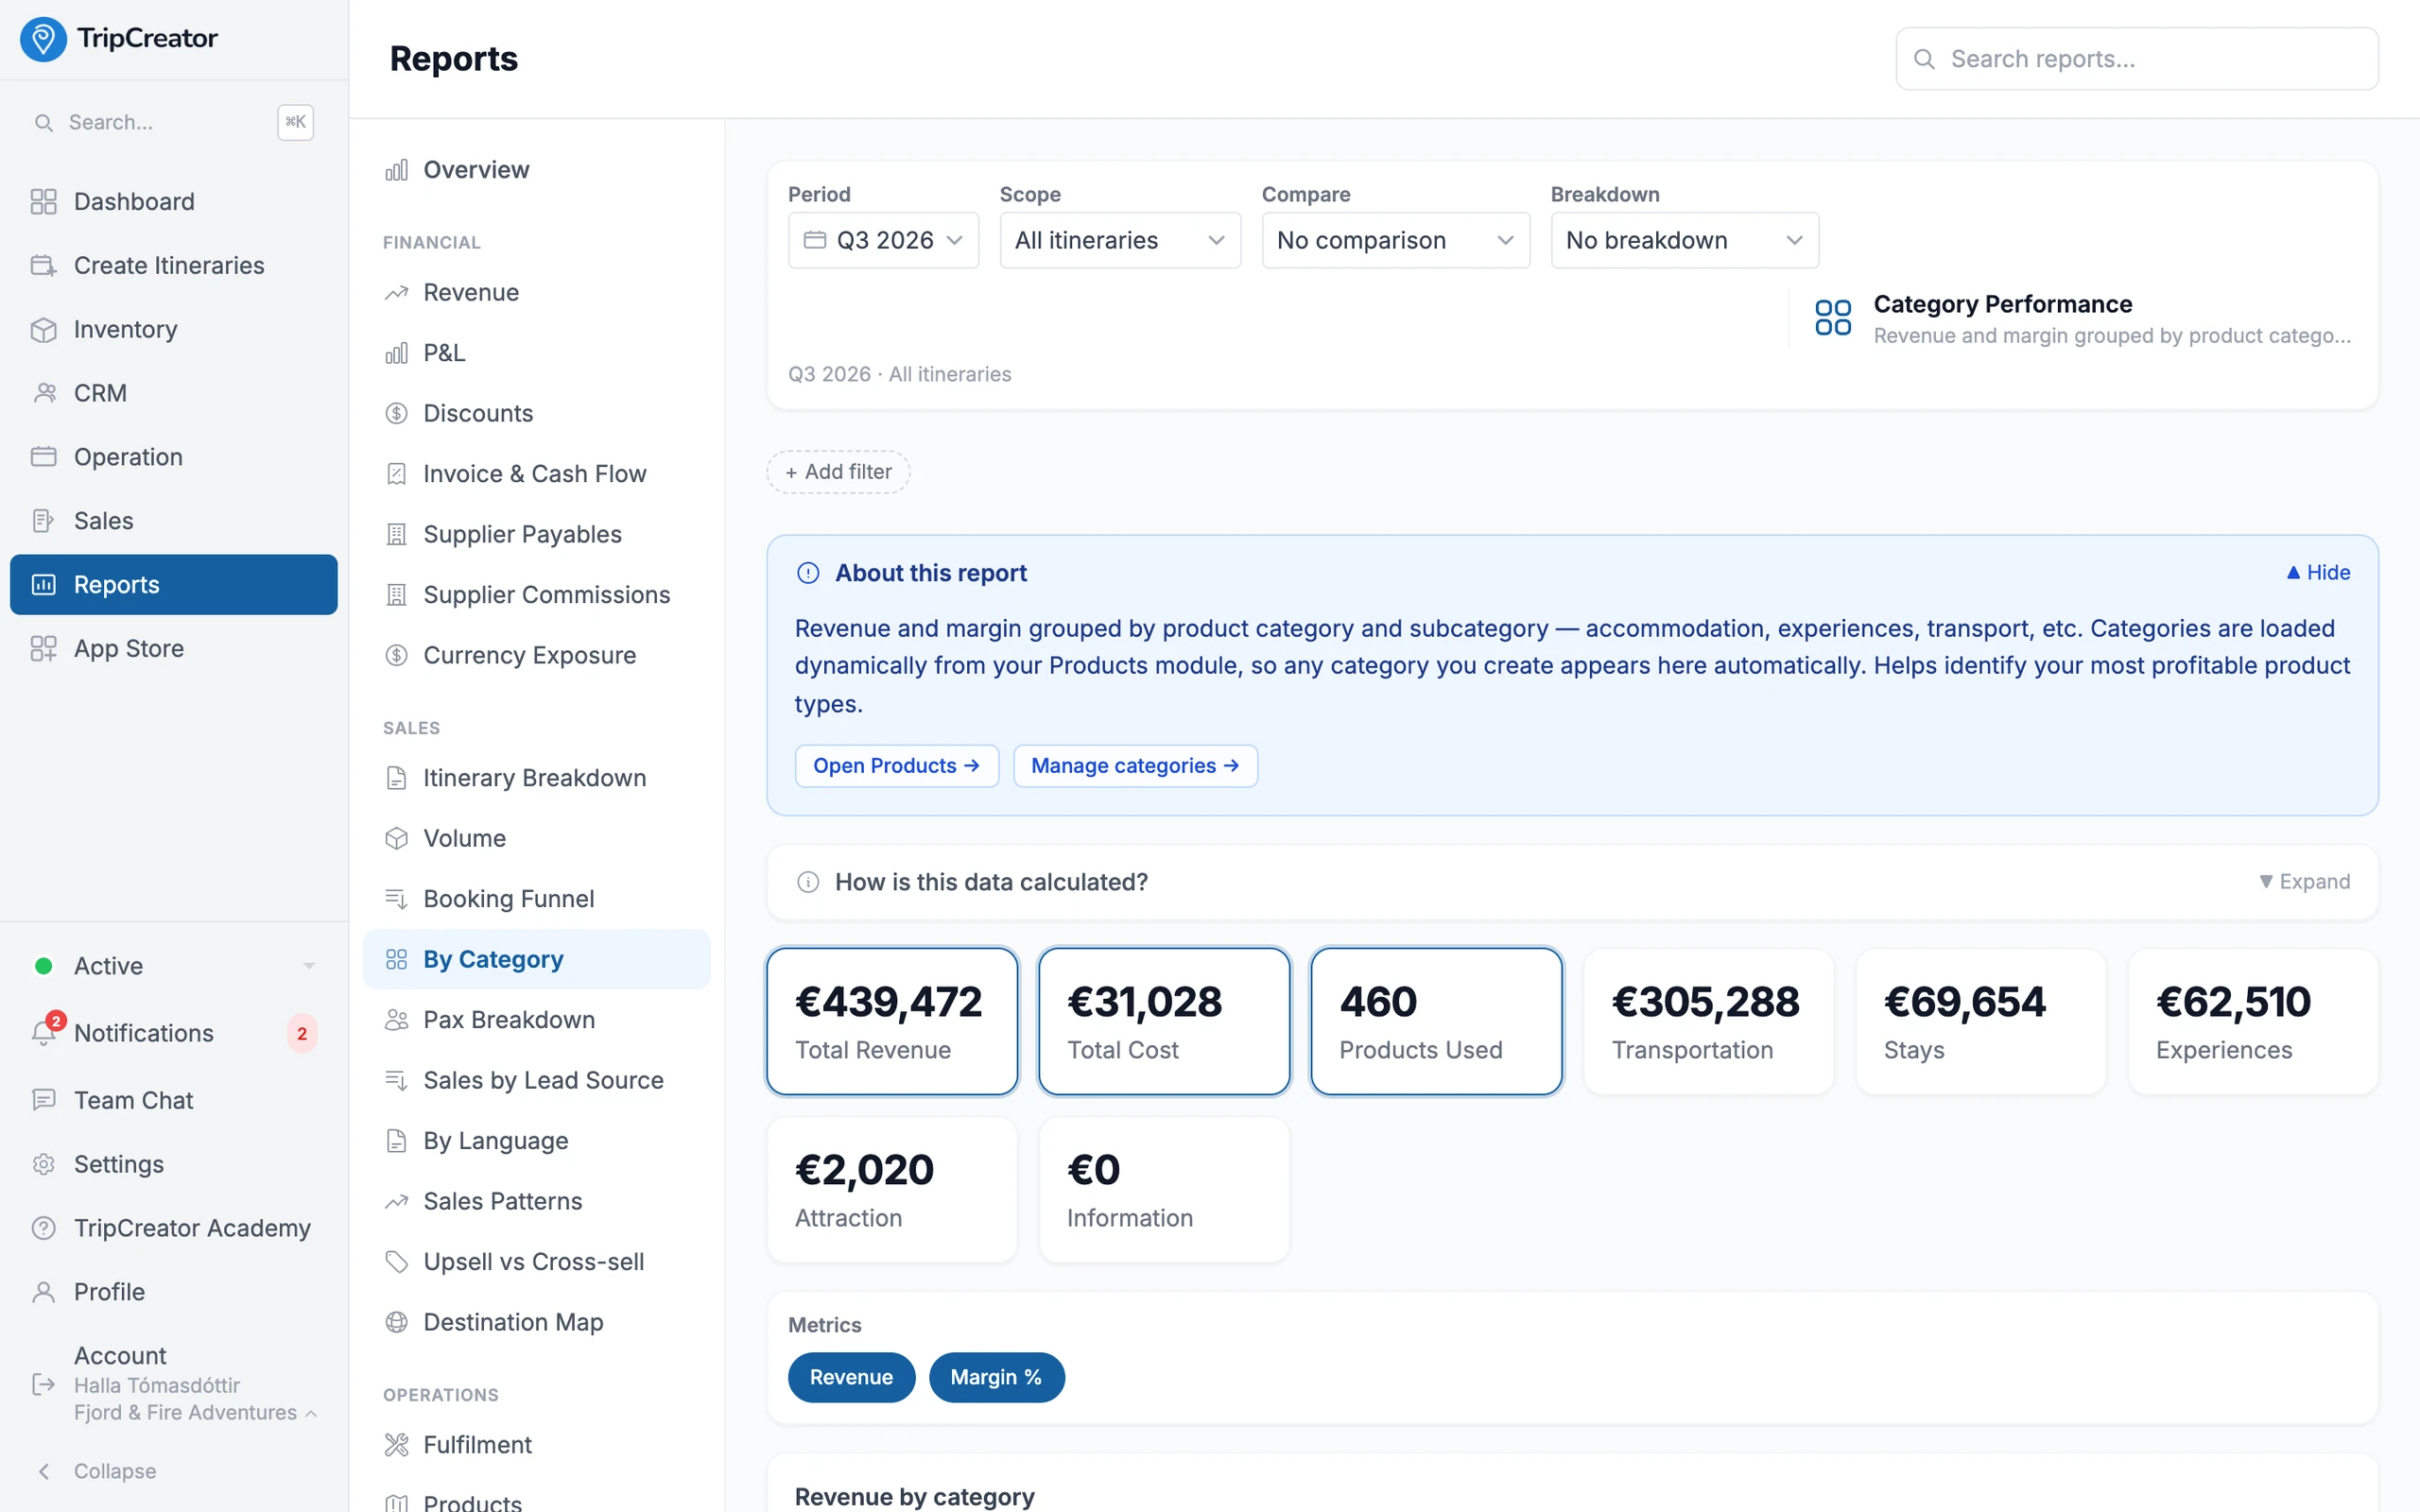
Revenue, cost and margin — broken down the way you actually sell.
Reporting FAQ
- Can I build my own dashboard?
- Yes. The dashboard is a configurable widget grid, so each team can surface the KPI tiles and charts that matter to them.
- Can I drill into a number?
- Yes. Every metric links through to the underlying bookings, invoices or products, so you can go from a headline figure to the detail behind it in a click.
- Does it report across multiple brands or workspaces?
- With the Enterprise add-on, yes — results consolidate across linked workspaces for a single organisation-wide view, and you can compare brands side by side.
- Can I export the data?
- Yes. Reports export for your own analysis or to share with finance, and accounting data also syncs two-way to Xero.
- Is there reporting on discounts and commissions?
- Yes — dedicated reports show what discounting costs you in margin, and track agent commissions and payouts ready to reconcile.